
“Calculating our revenue forecast is the lower of either our available capacity or our project demand. It’s the worst of both worlds!”
Finalizing our Services Plan
In our prior posts we covered important Professional Services Planning activities:
- Demand Planning, (planning new business and planning our backlog)
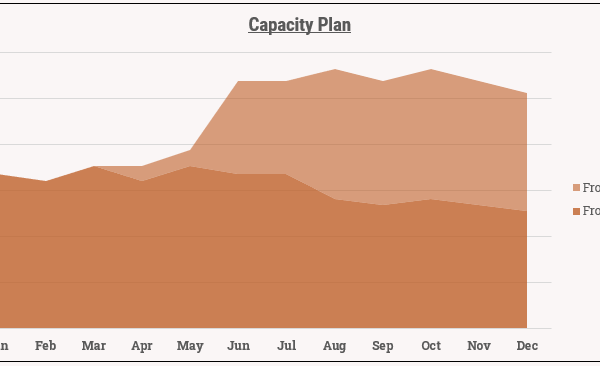
- Capacity planning (staff planning)
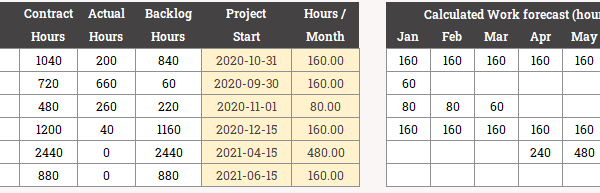
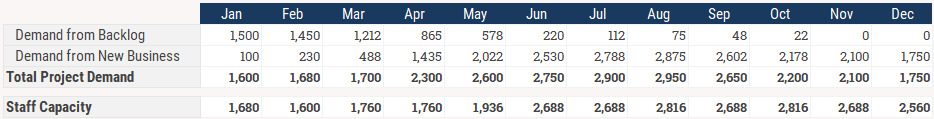
It’s now time to put these together and finalize our forecast. By reconciling these side-by-side, we can spot problems, calculate our anticipated revenue, and refine our hiring plan. Let’s say we arrived at these preliminary Demand and Capacity plans (numbers shown in hours):
Reconciling Demand plan against Capacity
There are two problems here at first glance:
- We’re understaffed early in the year: Our demand plan is exceeding short-term capacity. Work is spiking in April, May, Jun but the current headcount capacity is lagging far behind.
- We’re overstaffed late in the year: Our capacity plan catches up by September and appears to overcompensate by the 4th quarter. The demand for work falls below supply and seems to head that way into the new year.
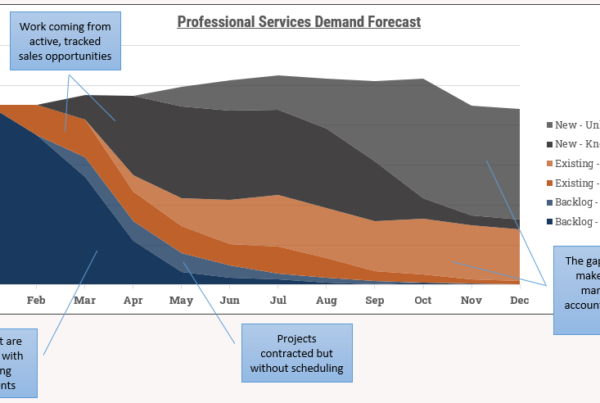
Let’s visualize this with a graph:
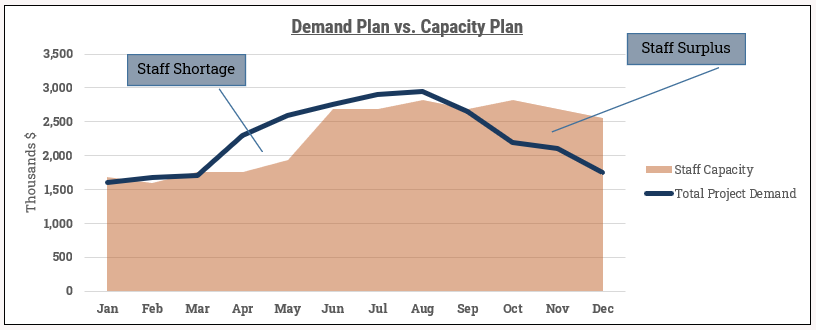
This graph gives us some directional insights, but it doesn’t tell the whole story. For one thing, we can’t calculate an accurate revenue plan based on this. I’ll get into that later in this post. More importantly, our graph ignores how demand and capacity interact over time. Our demand plan is in a vacuum when looked at on its own; we need to overlay our staff capacity to know the true, practical demand to expect.
Using overflow to calculate practical project demand
We need to introduce the concept of cumulative demand overflow. In April and May, our demand plan was outstripping our available staff capacity. That excess demand doesn’t go away of course, it just gets deferred into future months (unless the clients fire us for delays!). The excess demand from April gets added to May, which then gets added to June, and so on, until we have a consistent surplus to bring balance back to our plan.
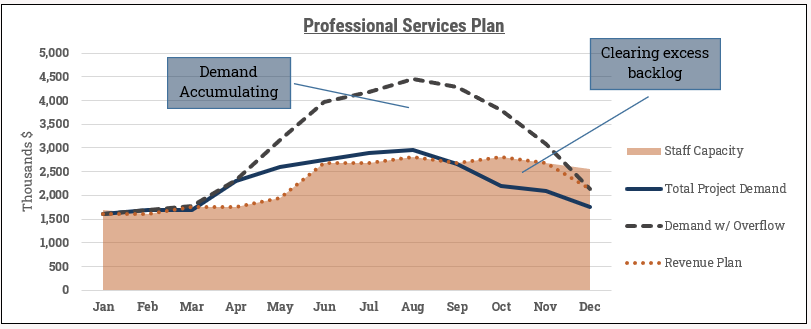
After plotting overflow, this tells us a different story:
- We now visualize a much more dramatic shortfall over the summer months. The understaffing has a cumulative effect and it looks like the team is going to be slammed from June to September.
- By December, our staffing plan has caught up with our Demand plan (Demand w/ Overflow crosses the Staff capacity line). The overstaffing in Q4 was enough to clear out the excess backlog from mid-year.
- Overall if we look at the balance of the year, our team is highly utilized from January to November and all the project work should be completed. We do appear to have minor small overstaffing in December.
You may have also noticed I sneaked revenue into the previous chart. Now we know the true demand and we can calculate our revenue and analyze our forecast.
Revenue Forecast
Calculating our revenue forecast is the lower of either our available capacity or our project demand. It’s the worst of both worlds! In short:
- If we have lots of staff but a shortage of project work, our revenue will be constrained by demand.
- If we have a shortage of staff and lots of project work, our revenue is constrained by our staff capacity.
Referring back to our graph, our revenue is capacity constrained through the first half of the year. By December, the pendulum swings in the other direction and we’re constrained by demand.
Validating our Professional Services Forecast
And that’s it. We finally have our revenue and headcount plan along with the associated costs. We likely have other costs as well, but we’ll save those for another day.
If we rolled with this current plan, is it adequate? Here are some considerations:
- In our example, we deferred mid-year work and then fully caught up later. Presumably, this means projects were delayed or slowed down in some manner. What is the impact on our customer? Will this cause engagements to fail or customers to drop our firm?
- Will the downward trend in project demand continue after December and into the new year? If so, we will be overstaffed again. What will the sales plan look like in the new year? What minimum sales metrics do we need to achieve to maintain the year-end staffing levels into the new year?
- Are we looking at this at a high enough resolution? We should take this view and isolate by specific roles and other perspectives as well. Do we have enough project managers in our forecast? Do we have too many junior associates and not enough senior associates? Are the staff being hired in the right regions?
The adoption of FP&A software makes this easier because we can take a multi-dimensional view of our business. Here we reconcile our demand plan against capacity for specific roles within a specific region:
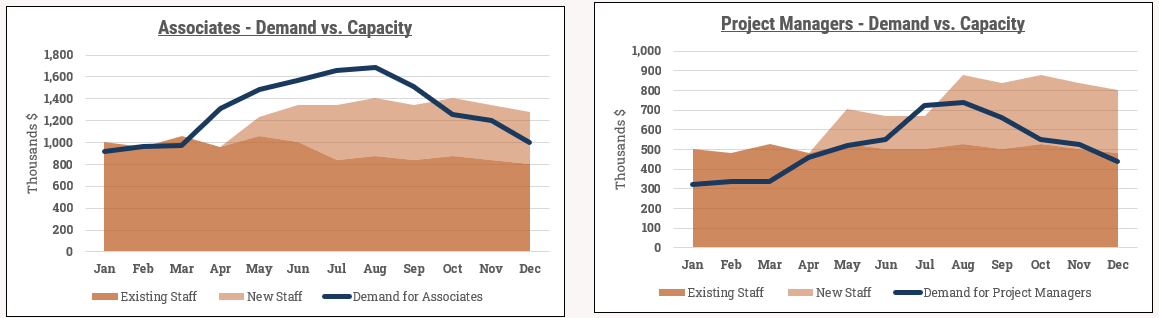
While total numbers may look good, we have some job roles that are overstaffed and others that are understaffed. We could also be split this by office/region, by line-of-business, or any other relevant segmentation.
Our next steps are to tweak demand and capacity assumptions until we have a plan that works. A good working plan has these characteristics:
- The expected output meets overarching business targets (revenue, customer satisfaction, etc)
- The headcount and associated costs are at acceptable levels.
- The plan still sets us up for sustainability in the future.
Sustainability with FP&A Software
I’ve covered a lot of detail in this five-part post. It’s not trivial to set up a finance process that makes this easy to do with high-frequency and with minimal manual efforts. The practical solution to this is to use FP&A / CPM / EPM software. FP&A software covers all the major components of the planning process I’ve covered here:
- A central database that stores historical actuals and forecast data, and allows you to slice-and-dice by customer segment, region, channel, line-of-business, role, and any others.
- The ability to load timesheets, contract data, employee roster information, and other datasets on an automatic and repeatable basis.
- A calculation engine that handles the demand plan and capacity plan calculations and allows you to change central drivers across multiple what-if scenarios.
- Standardized input templates for your professional services leaders and finance professionals, capturing inputs and seamlessly updating the central database.
- A structured workflow process where you can maximize collaboration across your organization and provide finance or services leaders with transparency across the process.
- A reporting and variance analysis engine that lets you constantly load your actuals and compare against your original budget or current forecast. Is the revenue variance due to lower bookings, a shortage of associates, or is it just timing issues? Is the cost variance due to higher costs-per-employee, an accelerated hiring plan, or is it just F/X?
If you put all this together, there’s no reason why you can’t build up a forecast every month. Or even more frequently than that. I went through a brief period where I produced a new forecast every single week during periods of high-external scrutiny from investors. With software as the backbone – with data sources auto-loaded and project portfolio adjustments centralized in one place – the production of a new forecast was a mere 90 minute exercise, with most of that time being spent on analysis.