
“Allocating our demand across roles gives us the right context for when we compare to our capacity plan later. We’ll know which specific roles are under- or over-serviced.”
Demand Forecasting
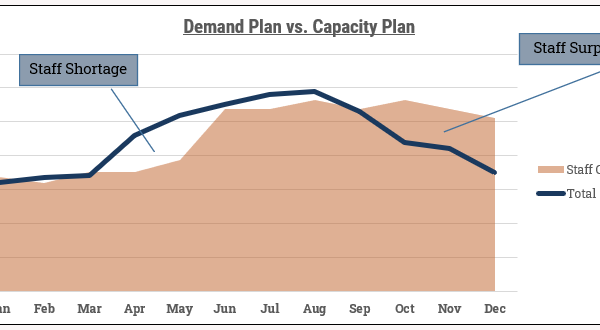
In our previous post, we touched on a broad planning methodology for Professional Services: (1) Forecast upcoming demand (2) forecast staffing capacity (3) reconcile and iterate.
Our professional services demand plan is the theoretical future work that our team will need to handle. Our demand plan is made up of two sources:
- Active Backlog. The existing in-flight engagements or engagements not started but under contract.
- New business. The future business, either expansion coming from existing customers or brand new customers.
This post will focus on the New Business portion, with a future post covering backlog forecasting.
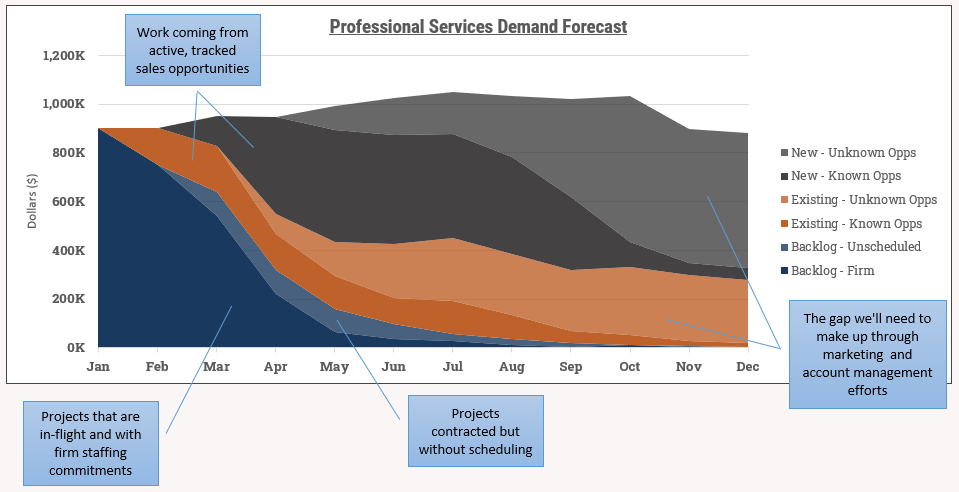
We can visualize the 12-month demand forecast in layers with the Active backlog making up most of the short/medium term work and new business making up the future work.
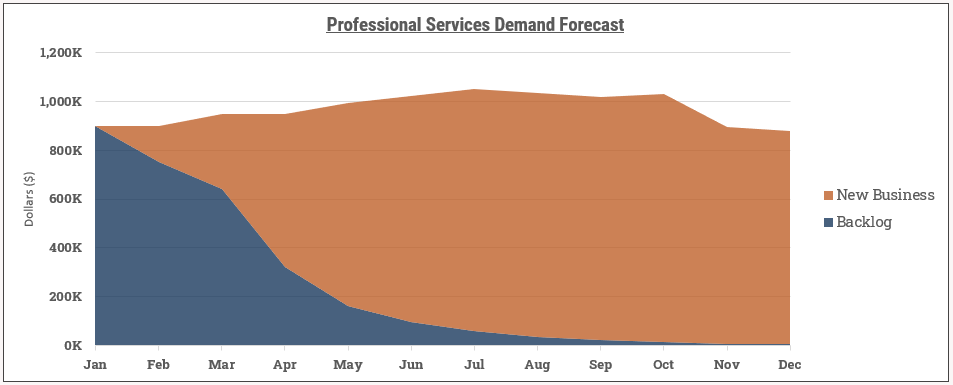
Here we see a project backlog that falls off sharply within 3-4 months, suggesting this theoretical company has short project engagements. 80% of the work in this fiscal year will come from new business. This is an especially risky company profile and highlights the need for frequent forecasting and a repeatable, technology-enabled process.
Forecasting New Business
New Business is a broad topic, so let’s break it down further.
- New business driven from existing customers. These could be change orders for active projects or they could be new phases of work altogether.
- New business driven from new customers. These are brand new customers (new logos) coming into the company, likely from the sales team or from rainmakers.
We can further subdivide New Business as either Known or Unknown. Some of the new business will come from named, tangible opportunities. The pipeline for the current quarter will likely have a list of named prospects, with expected sign dates, contract amounts, and other information. These are Known.
But if you look 3 quarters into the future, the situation is less clear. You may have a handful of named opportunities in your CRM, but not enough to meet your business plan. You can see the sales activities that will result in new deals, but just don’t know who it’s going to be yet. These are the Unknown.
We now have divided New Business into 4 sections (+ 2 if we include backlog). Within each section, we should identify who owns it and how it will be forecasted. That could look something like this:
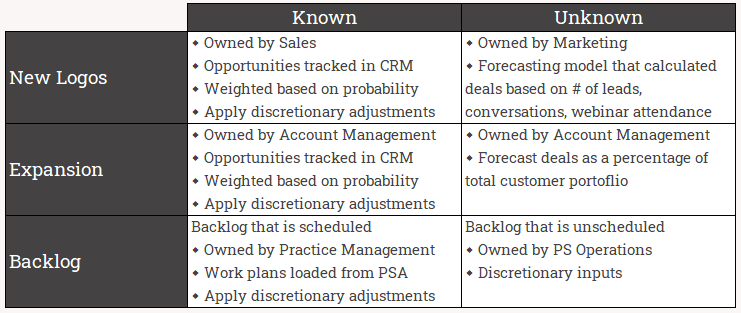
This example has both sales and account management teams tracking deals in the CRM system. The unknown new logos are driven by leading indicators from marketing, while unknown expansion is a simple function of the total customer portfolio. Our goal here is to arrive at a total number of deals that we can then use to calculate expected work demand.
Demand Segmentation
Let’s break this down even further. How else do you segment your business? Common segmentation might be:
- Practice / Service Type / Line of Business. What are your different types of service offerings?
- Sales Region. Do you sell into multiple countries? Multiple sales territories? Offices or branches?
- Sales Channel. Do you sell through direct and indirect channels?
- Customer Type. Do groups of customers have characteristics in common? By industry or size?
By segmenting our demand plan into one or more of these categories, we’ll be able to make very targeted assumptions and also analyze variance easier. Keep in mind, if the assumptions do not vary within a segment, you may want to ignore that segment for the purposes of demand planning. For instance, if you group customers by industry but your average deal size and pricing is always the same, you can safely ignore industry as part of your planning process.
Calculating the Work Demand
For calculating the work demand, we’re starting with a broad unit plan and key assumptions such as hours per deal and billable hourly rate. We could shift the planning earlier in the funnel and derive the units and bookings from a probability-weighted sales pipeline, while using statistics and data science concepts, but that is a whole other topic. We’ll keep it simple here and save that for a future post.
If we feed our expected number of deals and other key assumptions into our planning model:
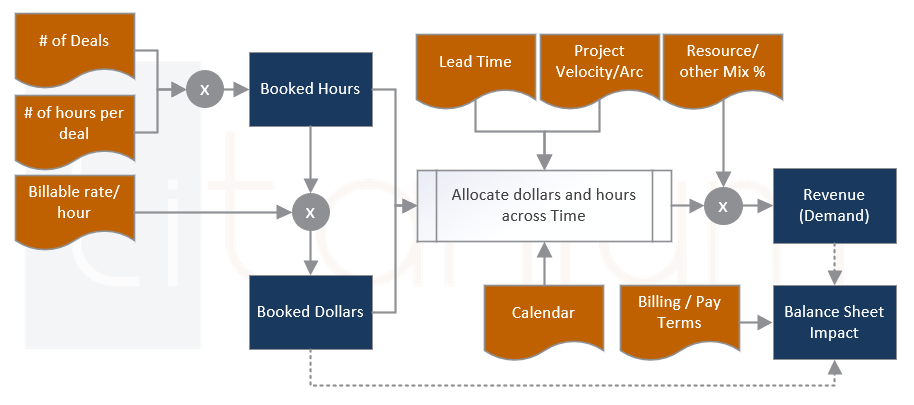
Our first step is to understand the total amount of Booked dollars and hours that are coming from our demand plan. These are straightforward price/volume calculations.
Once we have the booked demand, our second step is to estimate how the work will be realized over time. For this we need three additional pieces of information:
- Lead time. How much time passes between when a deal is booked and when the project starts.
- Project Velocity. How quickly does the project move. Once your project starts, how many months or years does it take to finish?
- Company calendar. How much available time is there in a given week or month.
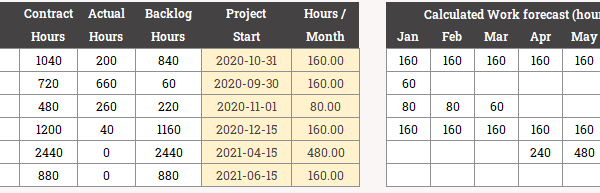
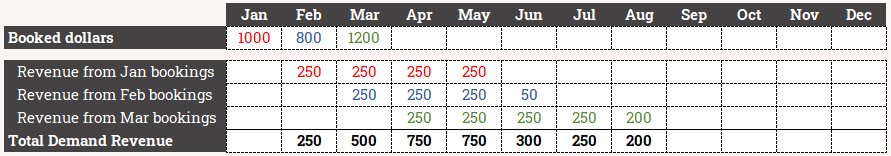
Each new group of deals that come in have their own assumptions and characteristics and so planning based on cohort is appropriate. This example shows $1000 hours booked in January. We’re planning a one-month lead time. $250 per month of work is being completed on a straight-line basis:
Our third step is to estimate the staffing this plan will require. More on this in the next section.
Our fourth step is to forecast cash and other parts of our balance sheet. This will vary depending on the standard pay terms you use. If customers tend to prepay, this will largely be bookings driven. If they pay in arrears, it will be more revenue driven.
Staffing Considerations
So far we haven’t said much about our staffing needs, but this is critical. You almost surely have a mixture of different roles in your organization; junior staff, senior staff, leadership and management, specialists, and so on. Your sales pipeline is unlikely to have project roles broken out on a deal-by-deal basis. But you probably do have a delivery methodology that defines how the roles break down by project type:

Here we have four different types of projects and seven different roles. The primary type appears more strategic in nature with 10% of the project budget reserved for the Partner and minimal help from junior associates. Type 2 is more straightforward and most of the project budget will go to juniors. Types 3 and 4 looks to be more niche based on the involvement from specialists.
By setting up an allocation table in this manner, you can take your new sales pipeline and understand what types of staff will be required. Our cohort analysis from earlier in now exploded into more detail:
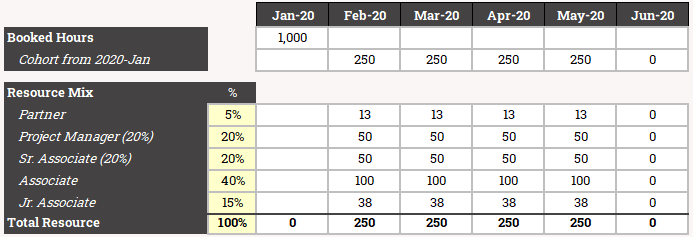
The example shows the hourly demand for each role coming from the Jan 2020 cohort. Allocating our demand plan across roles gives us the right context for when we compare to our capacity plan later. We’ll know which specific roles are under- or over-serviced.
In the next post we’ll get into the other major part of the demand plan: the active project backlog. For companies with long projects, the backlog may make up the majority of the demand plan. From there we’ll get into planning staff/capacity before capping the series off with how to reconcile the demand and capacity and finalize the plan.