

“If we’re exceeding our nursing capacity, what can we do?”
Modeling a Pandemic
These are trying times and Covid19 is the main concern for everyone right now. As I do with most things around me, I got to wondering: how could you model a pandemic and then measure its effects against the health care system? In this post I talk about healthcare and pandemic modeling. I’ll first discuss how we might create a model that predicts the virus behavior. Then I discuss how we might forecast healthcare needs to meet the increased demand.
Pandemic Modeling
For the terminology, I used the SIR model, which seems to be the standard for this sort of thing:
- Susceptible – People who can contract the virus.
- Infectious – People who currently have the virus and can pass it to others.
- Recovered – People who have had the virus and are now immune, or people who are deceased.
Other areas that we’d use for modeling the virus behavior:
- Infection period (γ)
- Transmission rate (β)
- Risk Factors and Severity
- Regional Transmission
Infection Period
Each infectious interacts with the susceptible over some period of time (i.e. A week) and converts a portion of them to infectious as well. A person can initially get infected on May 1st and then infect 3 new susceptibles between May 6 and May 8. This requires us to think about the problem by cohort, as shown in this simple example:
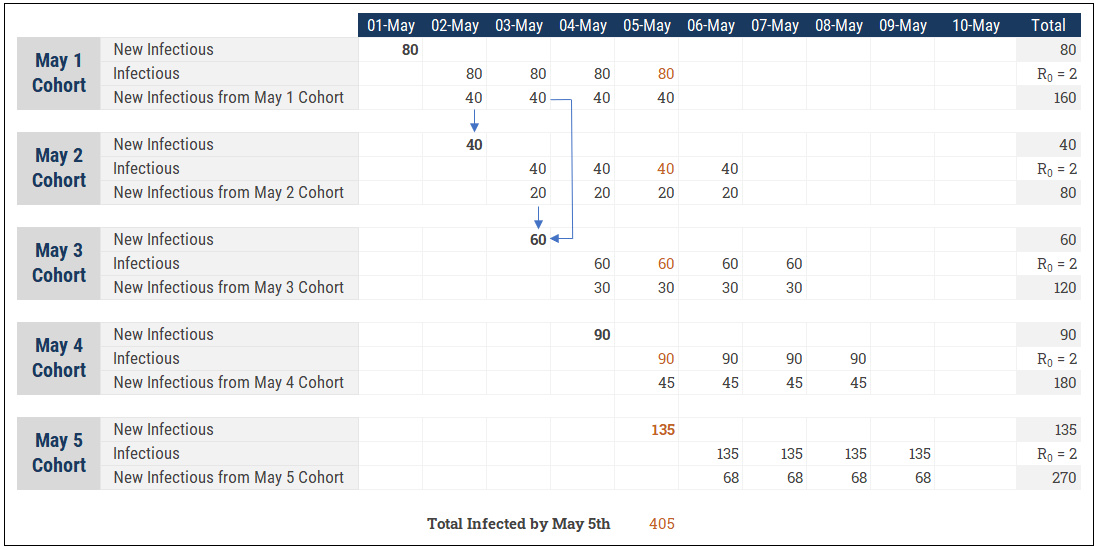
This is an important part of our modeling and we actually need two “time” dimensions to make this work. One is a the standard (daily) calendar for the model. The other I would call the “Cohort Aging” dimension that represents the behaviour of a daily cohort over time. For instance, 80 people are infected on May 1st. Those 80 people infect 160 more (R0=2) between May 2 and May 5. The 80 initial people have become 405 by May 5th when you accumulate the 5 daily cohorts (scary to see how quickly it can add up!)
Infection Rate
The basic reproduction number (R0) tells us how many susceptibles are infected by a single infectious when you have population that is 100% susceptible. An R0 = 3 means a single infectious person will infect 3 other people, all else being equal. This number is a good indicator of how quickly the virus can spread, but doesn’t really describe how the virus actually transmits over the course of time. This is known as the Effective Reproduction Number (R). Other factors are at play to help us understand R:
(1) Changing behaviors. At the onset of a pandemic, people reduce travel and start quarantining and this reduces the virus infectiousness.
(2) As more people get the virus, the pool of possible susceptible shrinks and the virus has a harder time transmitting to new hosts. At a certain point herd immunity kicks and in and the virus will start to die off when R falls below 1.0. To calculate when herd immunity kicks in, we use: [herd immunity %] = (1 – (1/[R0])
If COVID19 has an R0 = 2.5, we need 60% of the population to be immune for us to go back to how we used to live and still expect the virus to die off.
With that out of the way, we can consider taking a bottom up approach to modeling the virus transmission. R0 and R are good approximations, but we can break out the assumptions in more detail and calculate the resulting R afterwards as a sanity check.
Here we have assumptions that can vary by age group and by severity:
- Avg. days to become contagious – The number of days from when first infected until they start infecting other susceptible.
- Avg. days to show symptoms – The number of days for an infectious to start showing physical symptoms. Useful so that we can potentially model a different level of contagious
- Avg. Infected before symptoms – The transmission rate or R will be higher before a person knows they are sick.
- Avg. Infected after symptoms – R should go down when a person is sick as they rigorously quarantine (although it might not become 0, as health care workers or family members can still be infected if the person needs care)
- Avg. Length of illness – The average number of days from contagious to recovered.
- Avg. Hospital stay – The average number of days the infectious will stay in the hospital. Used to determine the number of hospital beds, the amount of PPE, and the hospital staff required.
- % ICU – The average percent of time spent in intensive care. Used to determine the number of ICU beds, PPE, and staff.
- % Fatality Rate – So that we know how many people are at risk.
- % Fatality Rate w/ No care – So that we know how many additional people are at risk if the health care system is overwhelmed and has no capacity.
- R0 Decay – A simple factor or index that lowers our infection rate over time, either because we’re approaching herd immunity or based on regional adjustments (i.e. One region quarantines everyone while another has no restrictions)
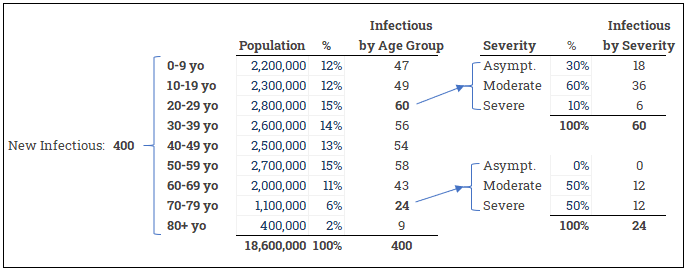
Risk Factors and Severity
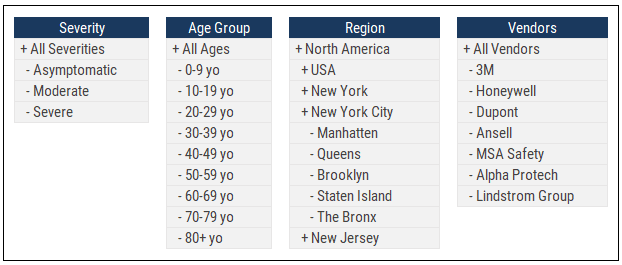
The demographics of a given area will greatly affect the healthcare impact and risk to human life so to model this properly we should split it further. I would break out a few dimensions: Age group, severity, region, and vendor.
- Severity helps us to model different assumptions depending on how serious the illness is; an infectious with severe symptoms may need 7 days of hospital time on average while asymptomatic doesn’t need any (but they do keep infecting the susceptible!)
- Age Group helps us to further specify severity. An older population will have more severe cases overall and will put further pressure on the health care system.
- Region allows us to fine tune regional population assumptions and compare against available hospital beds, health care personnel, and PPE. We might want to consider Hospitals as the lowest level of this dimension since our end goal is still helping to plan the health care response.
- Vendor lets us plan out new shipments of PPE and other supplies from manufacturers so that we can compare expected supply against the forecasted hospital visits.
Some other rules to keep in mind: The age of the infectious is not related to the age of the susceptible. A 5 year old can infect an 80 year old who could then infect a 45 year old. The severity of the illness for the infectious is not related to the severity for the susceptible newly infected. A 45 year old who is asymptomatic can infect a 70 year old susceptible who then develops severe symptoms.
These are straightforward allocation tasks to model. Here we start with total number of new infections and then allocate by age group and by severity:
Regional Transmission
The susceptible may acquire the virus from infectious outside their home region. An infectious from New York can travel to Boston and infect a susceptible there. We’d need an allocation table that looks something like this to model how the virus spreads between regions:
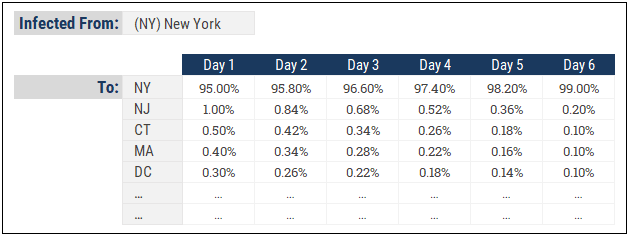
Here we see how infected people in New York might spread the virus to neighbouring states. Of course, this is much more relevant in the early stages of virus transmission when there are no travel restriction so in the advanced stages of a pandemic, the “home” region will retain close to 100% of the new infections.
Healthcare Modeling
The health care behavior is broken up into 3 main areas:
- Hospital Capacity – Beds, ICU spots, triage area capacity, other
- Equipment and Supplies – Masks and PPE, ventilators, drugs
- Staffing – Nurses, doctors, specialists, support staff
The planning concepts are similar for all three of these. If we wanted to plan hospital beds, we might look at it like this:
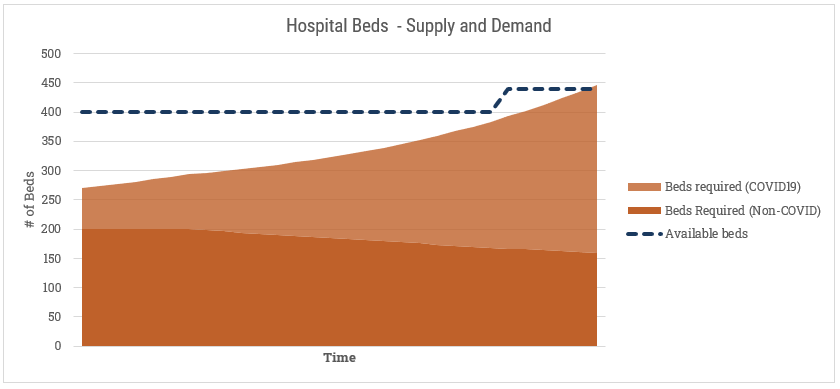
We have a certain number of existing beds. We also know that regardless of the pandemic, there are people sick or requiring hospitalization for other reasons. Hospitals have levers to play with here that we’d want to model in as well. For instances, we’d want to incorporate a “discharge rate” or “discharge aggression” factor here that increases their willingness to send an existing patient home for less serious problems (shown here with a gradual decline in the Non-COVID beds required). We’d also model makeshift ways of providing more beds, shown here with the late spike in availability. Perhaps they re-purpose old, obsolete beds from storage. A manufacturer or wholesaler could deliver a new shipment. They could receive a transfer from another hospital (although I suspect more likely they’d just send the patient to the hospital with more beds). A similar exercise would follow for ICU spots or ventilators.
Modelling for personal protective equipment (PPE) has one additional wrinkle, in that some of them are disposable and are consumed with use. If we take disposable masks as the example, we’ll want to maintain a balance of available units and draw those down as they get used, while replenishing with new orders arriving:
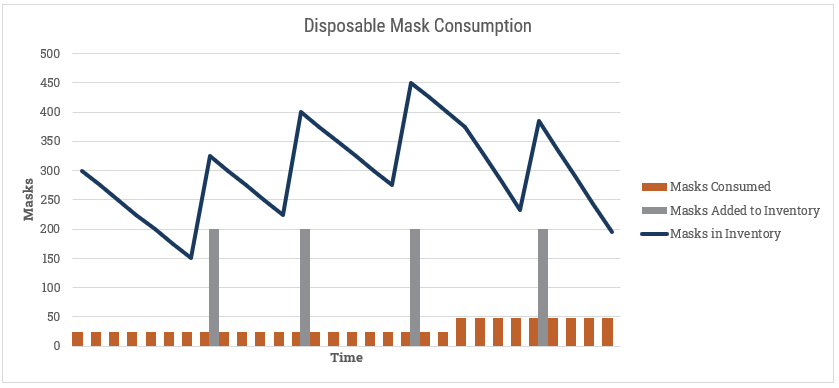
Here we could build a comprehensive model for adding new inventory that incorporates the source for new PPE, and includes vendor-specific shipment information from 3M and others.
For nurses and doctors, we can do something similar to hospital beds, although the levers change slightly. Some of the drivers we’d want to know if we were planning nurses:
- [# of nurses] – Number of nurses who are working that day
- [Hours worked per day] – The average number of hours the nurses work in a day (with admin time subtracted out)
- [Total Nurse Hours] – this is the [# of Nurses] x [Hours worked per day]
- [# of Patients] – This is the total of patients who require care from Covid19 and Non-Covid19 sources.
- [Hours per patient] – The amount of nursing care a patient requires
- [Patient Hours] – this is [# of Patients] x [Hours per patient]
Then we’d compare [Nurse Hours] to [Patient Hours] similar to our hospital beds example:
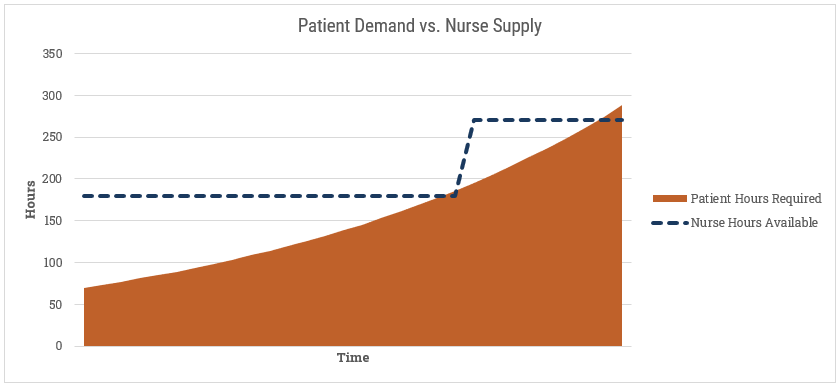
If we’re exceeding capacity, what can we do? The easiest option is to add more nurses. We can also extend the working hours per day (if they aren’t already at their max). Lastly, we may reduce the amount of time each nurse spends per patient. We can safely presume that if we’re spending less time with each patient, there is an impact somewhere else. If the level of care goes down then any/all of these can happen: (1) the length of the average hospital stay extends, (2) more patients go from standard care to ICU, or (3) the fatality rate goes up. I don’t envy the tough choices hospital administrators have to make.
Conclusions
The next step might be to pick appropriate tools to model this. Since I’m an FP&A software expert, of course I’ve wondered how well our various technology partners would hold up against this challenge. The multi-dimensional/OLAP nature of FP&A software the centralized calculation logic make it a very good option. After some basic prototyping, I’m confident you could model the virus behavior. But will it be better than any of the existing models or tools created by epidemiologists or statisticians? Probably not.
It has also occurred to me that this is a case where extra detail doesn’t help much in light of huge gaps in information. For instance, what is the R0 for COVID19? Not clear. How many people are asymptomatic? Not clear. How many people have had the virus but haven’t reported it? Not clear. We can’t see the forest for the trees. Refining our model and adding precise detail to our formulas may make it more accurate, but doesn’t it matter much if some of our core assumptions are off wildly. I didn’t discuss it in this post, but this would be a good case for Monte Carlo simulations to understand our of range of outcomes.
The more practical application here for FP&A technology is for the healthcare modeling. At it’s core, modeling the healthcare staff, equipment consumption, and hospital beds is an operational planning task that our FP&A technology partners are made for. All the main ingredients in an FP&A solution are helpful here:
- Loading source data so that you can see recent trends: This could come from various operational source systems such as staffing rosters and operational registries that track bed and equipment usage.
- Taking inputs from the field: Leadership can adjust staffing assumptions and admin staff can update daily inventory counts.
- Centralizing everything and modeling the future behavior: As discussed in this article, crunch the numbers and slice the results out by hospital departments, by type of illness, and other factors.
- Reporting the results and driving future decisions: Provide dashboards and reports back to line managers so that they understand how they’ve been doing and what’s likely coming up in the coming days or weeks. At a broad level, help municipalities pool information across healthcare centers.
This type of healthcare modeling isn’t just for a pandemic, but rather can be used by hospitals, physicians organizations, and other healthcare initiatives year-round. FP&A software can definitely help with healthcare and pandemic modeling.